Understanding the ins and outs of a social media platform is essential for choosing the right place to spend your advertising budget. Not all platforms are created equally, and each has its own set of benefits and drawbacks that can impact your business. Each platform also comes with its own unique features and tools that can help make your brand stand out from the competition.
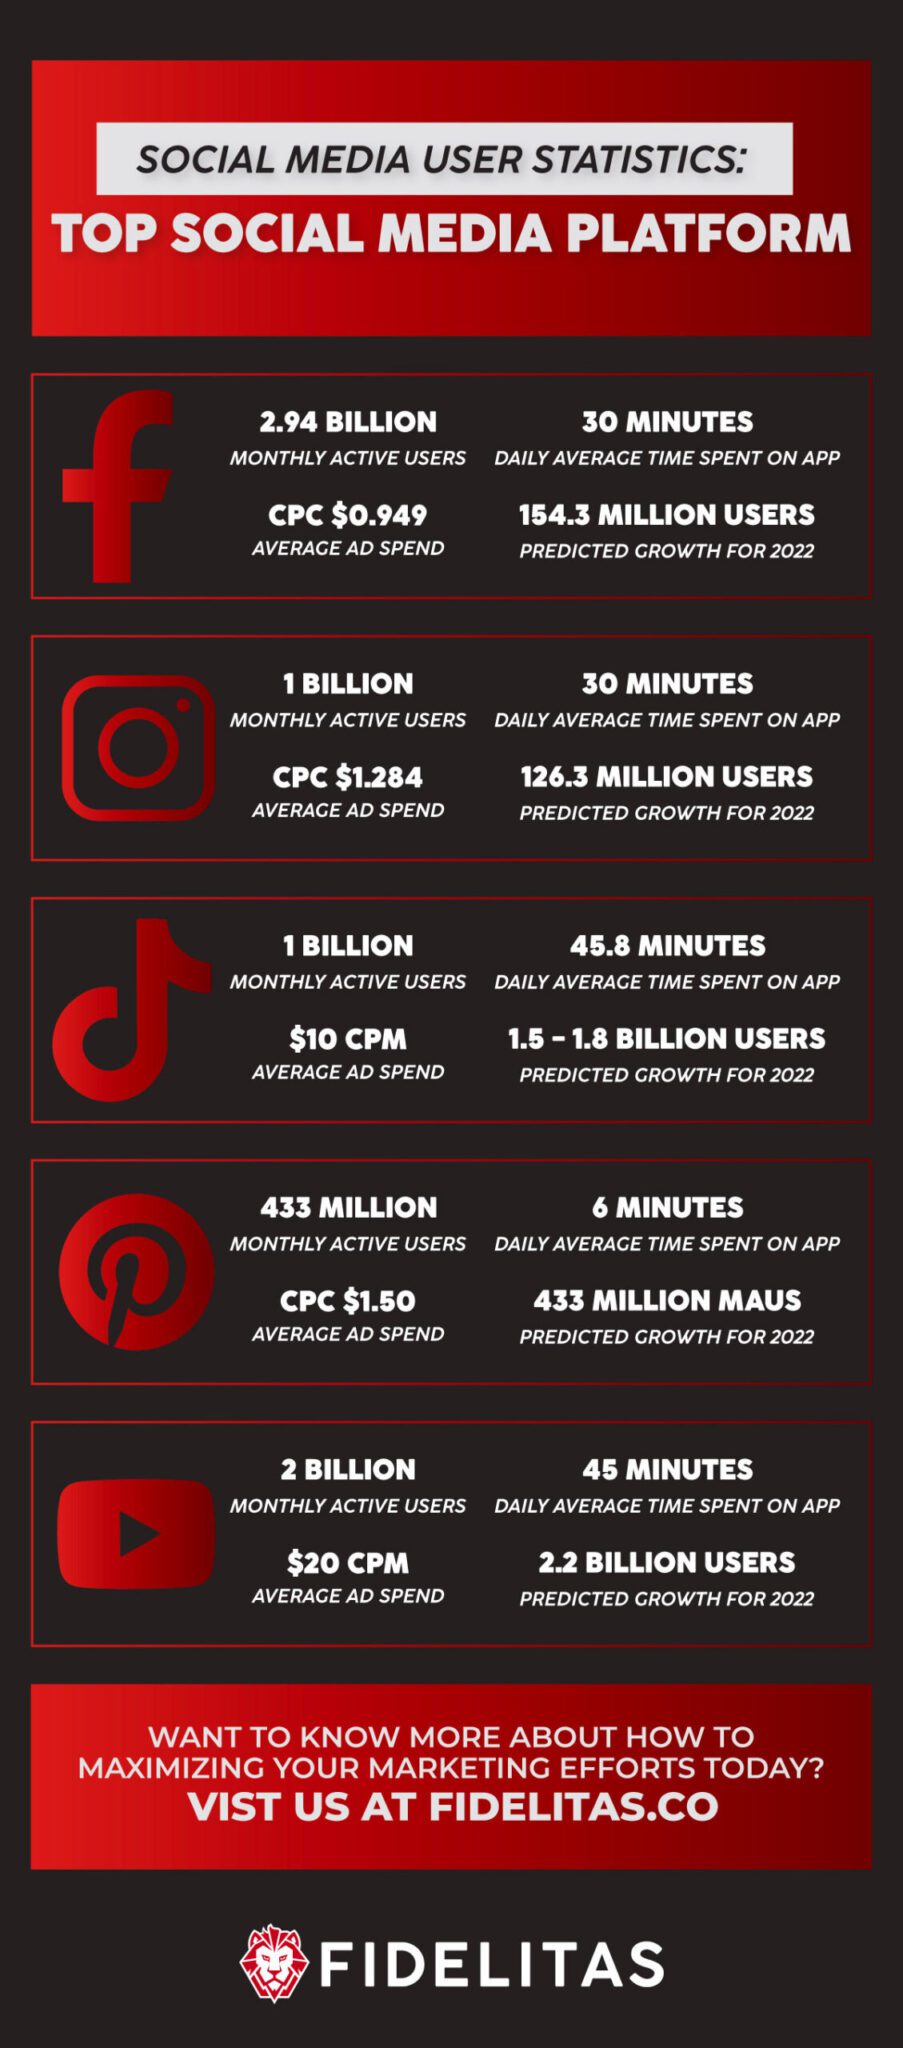
Throughout this article, we’ll go over a selection of the significant user statistics that will help you gain a better understanding of each platform and which is ultimately the top social media platform. These statistics include the Monthly Active Users (MAU), average time spent in-app, average ad spend, predicted growth in 2022, and the benefits of advertising on the platform.
Facebook
Instagram
Twitter
TikTok
Pinterest
Youtube
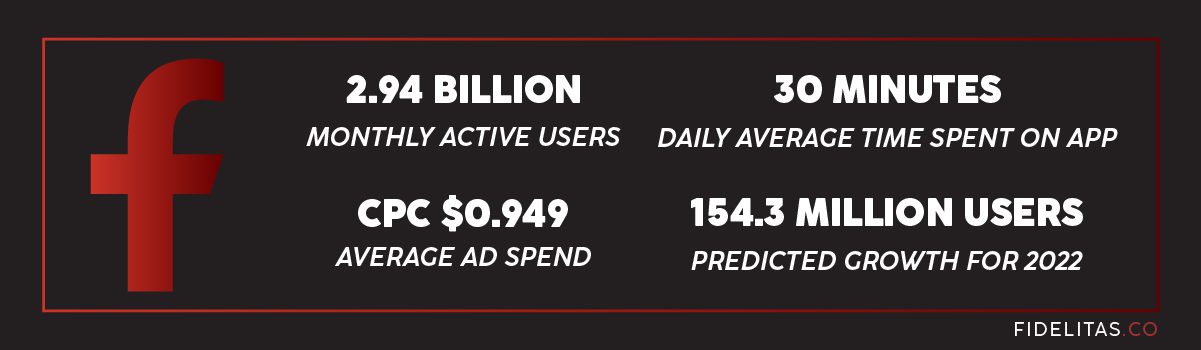
Facebook
The social media giant has had a rocky couple of years. The company was rocked by scandals in 2021, and shortly after, the holding company (Facebook, Inc.) changed its name to Meta Platforms, Inc. and announced plans to lean into virtual reality. Despite all this, Facebook as a platform remains one of the top social media platforms in the world, and the ad platform it provides businesses is second to none.
Monthly Active Users
According to Meta’s
Q1 Results press release, Facebook had an average of 2.94 billion monthly users in Q1. With nearly half of Earth’s population using the platform every single month, Facebook remains the most widely used social media platform in existence.
While it’s unquestionable that Facebook’s reach is enormous, knowing Facebook’s demographic makeup will help you better discern if the platform is ideal for your business.
In a 2021
Pew Research report, it was found that 69% of adults in the United States use Facebook. Women made up the largest portion of adult Facebook users at 77%, while only 60% of men used the platform. It’s also important to note that adults between the ages of 30 and 49 are the largest demographic of active Facebook users. Meanwhile, only 50% of those 65 and older reported using Facebook.
Daily Average Time Spent on App
As of February 2022,
Insider Intelligence points out that U.S adults spend an average of 30 minutes on Facebook every day. So while Facebook might have the most users in the industry, its users are among the least active when compared to other platforms.
Average Ad Spend
Data from Shopify shows that at the onset of 2022, the
average cost per click (CPC) was $0.949, which is among the cheapest in the Industry. Throughout the year, that figure has fluctuated, and current data shows the
CPC dipped to $0.874 throughout the month of July.
Meanwhile, the monthly cost per impression
(CPM) was calculated to be $12.31 at the end of July. Typically, the average CPM spiked around November and December due to increased demand from Black Friday and Christmas. This figure starts to decrease throughout the Spring and Summer months before starting to rise again in September and October.
Predicted Growth for 2022
Digital Information World predicts that in the U.S there will be 23.3 million users under the age of 25 and a growth of 3.3 million users over the age of 25, totaling 154.3 million users in 2022.
What are the benefits of Advertising on Facebook?
As well as being the most widely used social media platform,
Meta also says that companies can advertise through it in a variety of ways. First, you have the option to boost specific posts on your page to increase engagement. Second, you have the option to boost your Facebook page as a whole to expand and increase followers.
Finally, Facebook allows you to present a CTA such as a link to your website on your business’s Facebook Page. So when users visit your page, they will become more likely to visit your website.
Another critical consideration is the built-in compatibility with Instagram. Since they’re owned by the same parent company, you can easily cross-promote your advertisements across the two platforms. And since Facebook users are highly likely to also be Instagram users, being able to advertise across both platforms seamlessly makes users more likely to see and convert from your ads.
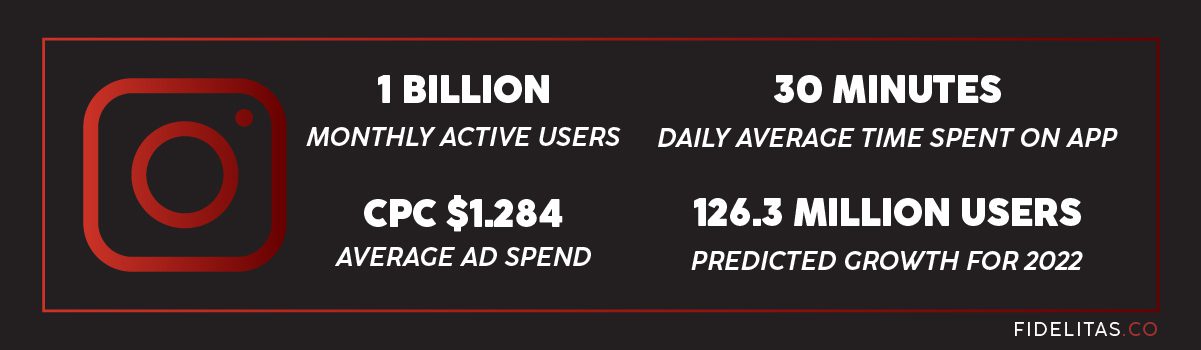
Instagram
Instagram took the world by storm when it launched back in 2010. Its focus on visual content provided creatives with a whole new way to share their art on the internet. It wasn’t long before the flashy picture grid app caught the eye of Facebook, Inc., which bought the company in 2012.
The app has gone through significant changes in the years following its release. As the world became accustomed to still digital images, the app began copying competitors—most notably Snapchat and TikTok—to stay relevant in the changing digital landscape.
Monthly Active Users
Since reporting it had broken 1 billion monthly users back in 2018, Instagram has been unsurprisingly quiet about its userbase growth. While it might seem odd that one of the top social media platforms hasn’t released official figures for several years, this silence is likely due to the increased scrutiny the company has faced from Capitol Hill as the company’s target demographic shifted from adults to teenagers.
While the official number of active monthly Instagram users is currently unknown, sources at
CNBC reported that Instagram reached 2 billion monthly users back at the end of 2021.
Of Instagram’s 2 billion monthly active users,
70% are under the age of 35, and nearly 40% are under the age of 25.
There’s a relatively even split between Instagram use between men and women across all age groups.
Daily Average Time Spent On App
Following in Facebook’s steps, Instagram users are among the least active across all platforms. In fact, as of this past April, both of Meta’s primary social media platforms fell behind TikTok, Twitter, and Youtube in daily average use.
The average user spends only
30 minutes on Instagram every day. While that’s still a significant amount of time, it signals that users are moving away from legacy platforms to up-and-coming platforms like TikTok. This is despite the fact that Instagram has attempted to retain its user base by copying TikTok’s formula via Instagram Reels.
Ad Spend
Advertising on Instagram has consistently been more expensive than on Facebook. In July, the average
cost per click was about $1.284. That’s nearly 47% more expensive than the CPC on Facebook.
However, the same cannot be said for the average monthly CPM, which has been consistently lower on Instagram when compared to Facebook. In July, the
average CPM on Instagram sat at $11.03, which is about 10% lower than Facebook over the same period of time.
Like Facebook, the cost of Instagram ads starts rising throughout September and October before peaking in November and December after the holiday season comes to an end.
Predicted 2022 Growth
According to
Insider Intelligence, following Facebook, Instagram will reach 126.3 million total users in the U.S alone by the end of 2022. By the end of 2025, it’s estimated that the platform will reach ¾ of Facebook’s total user base.
At the global level, Instagram has seen its most considerable growth in the Asian Pacific region and, more specifically, India (which banned TikTok). So if you’re an international brand looking to tap into that market, Instagram is the best place to be.
What are the benefits of advertising on Instagram?
Instagram users are nearly guaranteed to follow businesses. In fact, only a shrinking minority (
10%) of Instagram users aren’t following at least one brand. This suggests that Instagram users are looking for products and services when they use the app. Instagram even states that 87% of users take action after seeing a product being advertised on the platform.
Instagram also provides a range of ad formats to engage users at every level. While most companies sink their ad budgets into mainline Instagram feed ads, setting aside some of your budget for ad placements in both Instagram Stories and Reels ensures that you can reach your audience regardless of how they spend their time on the app.
Twitter has been around for 16 years now, and while the platform is most widely known for its short-form content, the app has been steadily expanding its ad suite and gaining more buy-in from marketers.
Despite these changes, the app has been constantly embroiled in controversy over the past several years. From accusations of partisan censorship to its impending legal battle following a fallout with Elon Musk, Twitter has been stealing center stage at the national level. Despite the controversies, Twitter remains one of the top social media platforms available.
Monthly Active Twitter Users
Getting clear active user statistics from Twitter is a tumultuous practice. For starters, Twitter reports its active user statistic differently than other social media platforms; they came up with their own metric called “monetizable daily active users” (mDAU) to help show quarterly growth. This represents the number of users who log in on any given day and are able to view ads.
To make matters even worse, in this year’s
Q1 earnings report, the company stated that they had been overestimating their monetizable daily active users for the past three consecutive years. This discrepancy is rooted in the fact that people might own multiple accounts, and Twitter states that each account was being erroneously counted as an individual active user instead of being grouped under a single active user.
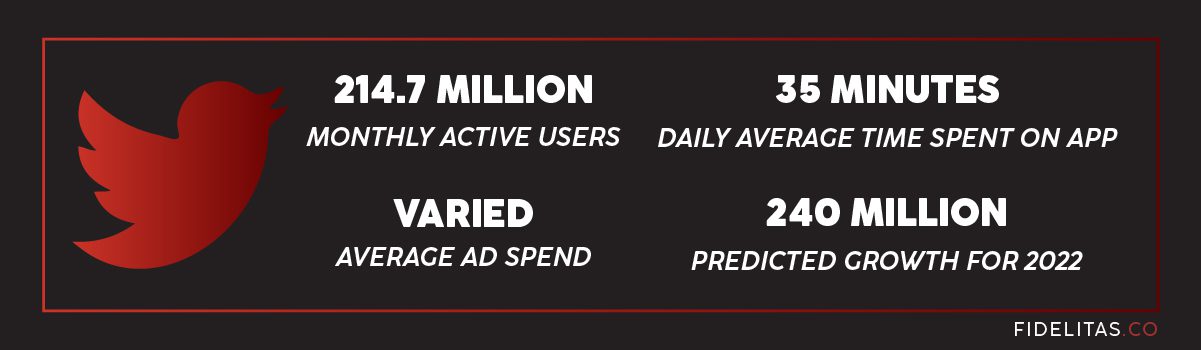
Their latest estimates show that their total global mDAU is 214.7 million people. Only 37.5 million of those users, or 17.5% of the total mDAU, are within the U.S.
Given their previous errors in reporting, it would be wise to take these numbers with a grain of salt.
Daily Average Time Spent On Twitter
Twitter users are among the most active of all social media platforms, with an
average of 35 minutes every day as of April 2022. So while it’s behind TikTok and Youtube in average daily usage, it beats out both of Meta’s platforms.
Ad Spend
Much like Facebook and Instagram, Twitter ads operate on a bidding system that determines winners by calculating an ad’s score (quality score x bid amount). Twitter then charges advertisers for each
billable action that gets taken. Billable actions could be anything from gaining followers to driving website traffic to even downloading your app.
Due to the wide variety of billable actions, calculating the average ad spend for Twitter can be very difficult as no two billable actions cost the same amount.
Predicted 2022 Growth
Given their previous misgivings in userbase reporting, it’s hard to estimate how much Twitter will grow over the course of 2022. That being said, their latest reports show an average growth rate of 2.5% per quarter at the global level. So it’s possible that Twitter could reach 240 million mDAUs by the end of 2022.
Over the same five-quarter period, Twitter’s U.S. userbase only grew by 1.6%—or an average of 0.32% each quarter. In its Q1 earnings report, it announced that it had 39.6 million mDAUs in the U.S; that’s 2.1 million (5.4%) in the first quarter alone. That far outpaces their average growth over the last 15 months.
What are the benefits of advertising on Twitter?
While their user base is only a fraction of their competitors, their users are highly active and engaged, with one of the highest average daily usage times among all platforms.
Twitter announced that users on Twitter spend twice the amount of time looking at launch ads and 3.3 times viewing post-launch ads. They also offer safe advertising features; they offer conversation controls for ads on the platform and claim to remove any misinformation.
Twitter shared one of their success stories, where an e-commerce brand named “
Bolt” got viewed on Twitter by 5 million people within a week!
Twitter has a growing global presence, and users are clearly interested in what brands have to offer. So if you’re looking to expand your reach and aren’t running as on Twitter, now is a great time to start!
TikTok
Despite being the new kid on the block, TikTok has made quite the splash in the marketing world since it started gaining popularity in 2019. It blew up in 2020 and become one of the top social media platforms with over 2 billion downloads globally.
But it hasn’t been always been easy for the fledgling platform. The platform faced scrutiny from Capitol Hill under both Donald Trump and Joe Biden’s presidencies. Outside the U.S., the app has been banned in several counties, including Indonesia, Bangladesh, Pakistan, Armenia, and Azerbaijan. India also banned the app in 2020; this resulted in Instagram becoming the fasted growing photo/video platform in the country.
Despite these adversities, TikTok has made itself a mainstay in the marketing industry, and brands should consider expanding their marketing efforts to the platform.
Monthly Active Users
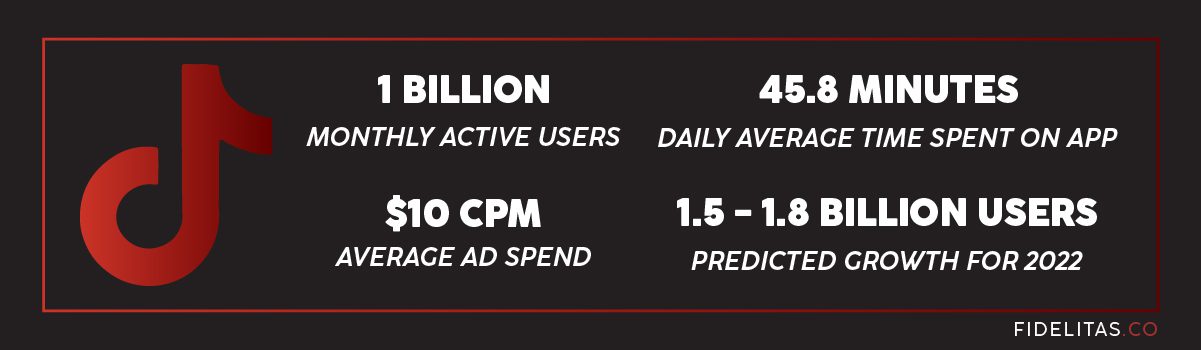
On September 27th, 2021, TikTok announced that they had broken 1 billion monthly users worldwide. For a platform that celebrates its 6th birthday in September, that’s a huge milestone and goes to show how dominant the app has become. For reference, it took Facebook nearly nine years to reach 1 billion users, and it took Instagram nearly eight years.
Daily Average Time Spent On App
As of April 2022, it’s estimated that the average TikTok user spends a whopping total of
45.8 minutes on the app every day. This is the highest daily usage across all platforms by a wide margin, beating every other platform—aside from Youtube—by over 10 minutes.
Ad Spend
Standard TikTok ads start at a
$10 CPM. But it’s essential to keep in mind that TikTok’s minimum daily spend requirement is $20 and the minimum campaign requirement is $500. The cost for other ad formats is even higher, with “hashtag challenge” campaigns starting at around $150,000 for the first six days and “brand takeovers” starting around $50,000 each day.
Predicted 2022 Growth
There’s some speculation about how quickly TikTok will be able to reach the 2 billion active monthly users benchmark. The London-based data insight group
Business of Apps speculates that the app could grow to 1.8 billion users by the end of 2022. While more conservative estimates place the app a 1.5 billion by the end of the year. If either of these predictions turns out to be accurate, it would be unprecedented and would prove once and for all that TikTok is more than just a flash in the pan.
What are the benefits of advertising on Tik Tok?
TikTok is quickly making up ground against its competitors and is the fast-growing social media platform on the market. But the broad reach is only one of the benefits that marketers can take advantage of on TikTok.
The app offers brands a whole host of tools to interact with their audiences. But what makes TikTok so unique among other platforms is that it doesn’t pigeonhole brands into traditional ad formats that can cost a fortune. While dropping thousands on TikTok campaigns is certainly a viable strategy that can yield tremendous results if done correctly, you can also reach TikTok’s massive user base through viral organic content. Or you can pay influencers to make content promoting your brand and gain access to their audiences.
Pinterest
Pinterest is a unique case because it’s a platform that has been around for years but never really gained much attention from marketers. At least until recently. Marketers who slept on the platform for years are starting to give it more attention. And while Pinterest might not be the top social media platform, it still presents viable marketing opportunities that shouldn’t be ignored.
Monthly Active Users
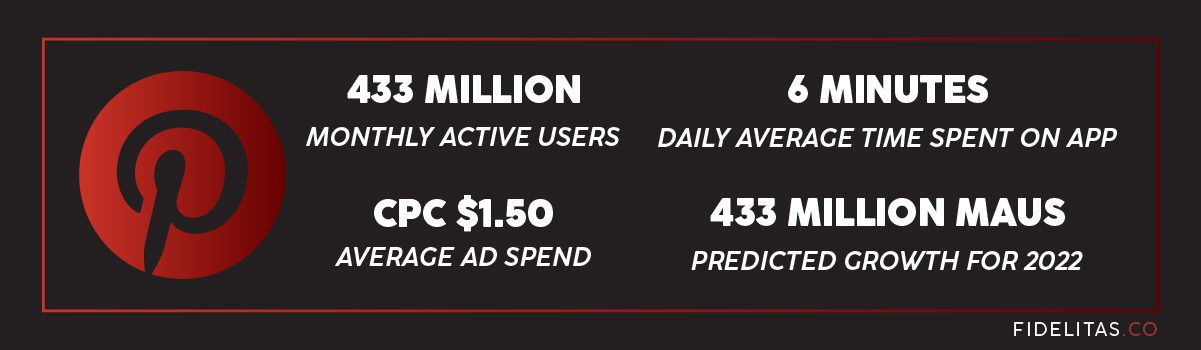
Pinterest Business claims that it had 433 million monthly active users at the end of Q1 this year. They also reported that women made up 60% of the active user base, men made up only 40% of the user base, and 45% of all pinners make over $100,000 every year.
Daily Average Time Spent On App
Pinterest’s average daily use statistics are staggeringly low.
Influencer Marketing Hub reported that the average user spends only 6 minutes on the platform per day, but that short time is offset by productivity as users visit five pages during their short time scrolling.
Ad Spend
Pinterest has one of the
lowest CPCs in the industry at only $1.50. If you’re simply looking to increase your brand awareness through Pinterest, then you can expect your CPM to be at least $2 since that’s the minimum that the platform allows.
Predicted 2022 Growth
According to a
letter to shareholders, Pinterest saw a 6% decline in its monthly active user base over the course of 2021; despite the decline in users, the company’s revenue increased a whopping 52% YoY to $2.5 billion!
While userbase growth through 2022 has stalled at 433 million MAUs,
revenue increased 18% YoY in the first quarter and
9% YoY in the second quarter of 2022.
It’s uncertain whether the userbase will grow or shrink over the remainder of the year, but Pinterest expects revenue growth to be in the single digits following industry-wide headwinds.
What are the benefits of advertising on Pinterest?
While Pinterest doesn’t have the largest or most active user base in the industry, active users are accessing the site with the intention of purchasing. Pinterest Business reports that retail brands see
two times higher ROI on Pinterest than on other platforms.
One other thing that makes Pinterest really special is that it isn’t just another social media site. It’s a search engine, and there are some SEO best practices that can help extend the life of your content and make it stand out.
Youtube
Youtube is the second largest search engine in the world, and it’s owned by the same parent company that owns Google—the largest search engine in the world. While it certainly isn’t a traditional social media platform, it has made changes in recent years to try and compete with the likes of other top social media platforms like TikTok and Instagram.
Monthly Active Users
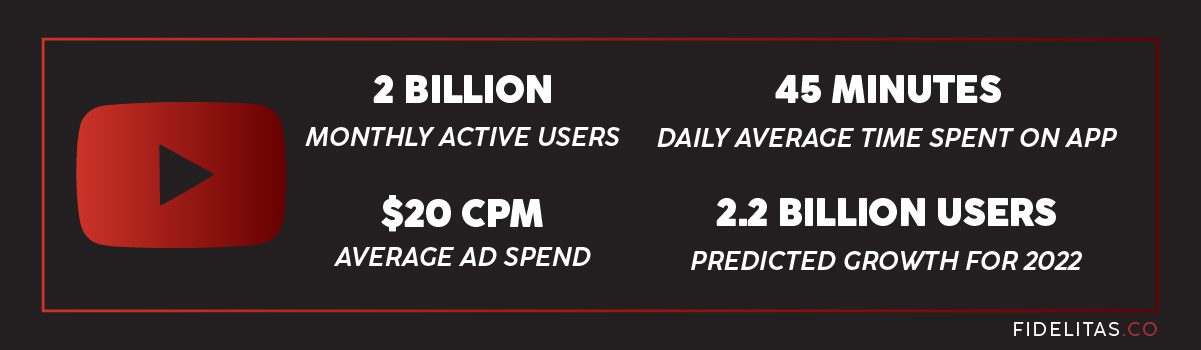
Youtube states that they have 2 billion logged-in monthly active users this year. Usage across demographics is actually reasonably even across both gender and age groups. More than half of Gen Z and Millenials use Youtube, and nearly half of Gen X use the platform, according to
HubSpot.
Daily Average Time Spent On App
The average Youtube user spends 45 minutes on the platform every day, making it the second most used app right behind TikTok. One reason for this is the length of content on the platform. The average Youtube video is over 10 minutes long, so users logging into the app already anticipate spending a more extended period of time on the platform.
Ad Spend
Youtube ads aren’t cheap. You pay youtube for every 1000 views your ad receives, and the average CPM is around
$20.
Predicted 2022 Growth
Youtube’s
revenue grew 14% in Q1 and
4% in Q2 to $8.6 billion and $7.3 billion, respectively. Google isn’t optimistic about revenue growth throughout the remainder of 2022 following the current global economic slowdown. Alphabet gave no guidance on user base growth, but it’s safe to assume it will continue to climb towards 2.2 billion monthly active users.
What are the benefits of Advertising on Youtube?
As the second largest search engine on the internet, Youtube provides businesses with a ton of opportunities to promote their products to consumers. Since users spend an average of 45 minutes on the app each day, they’re very likely to see your advertisements and engage with your content. In fact, Google claims that
70% of Youtube users buy from brands they see on the platform.
Youtube also offers many types of ad formats such as bumper ads, In-feed video ads, responsive display ads, masthead ads, non-skippable in-stream ads, and skippable in-stream ads. So you can customize your marketing approach on the platform to put your product or service in front of a highly engaged audience.
Jumpstart Your Social Media Strategy Today
There are ample opportunities for brands of all sizes to market their products on social media. If you’re not sure where to start and want help creating a
sound social media strategy that will help you grow your business, contact Fidelitas today! Our experienced teams are ready to move the needle for your business.